Marketing Budget Planning
The Plans Editor view allows you to manage your marketing team budget.
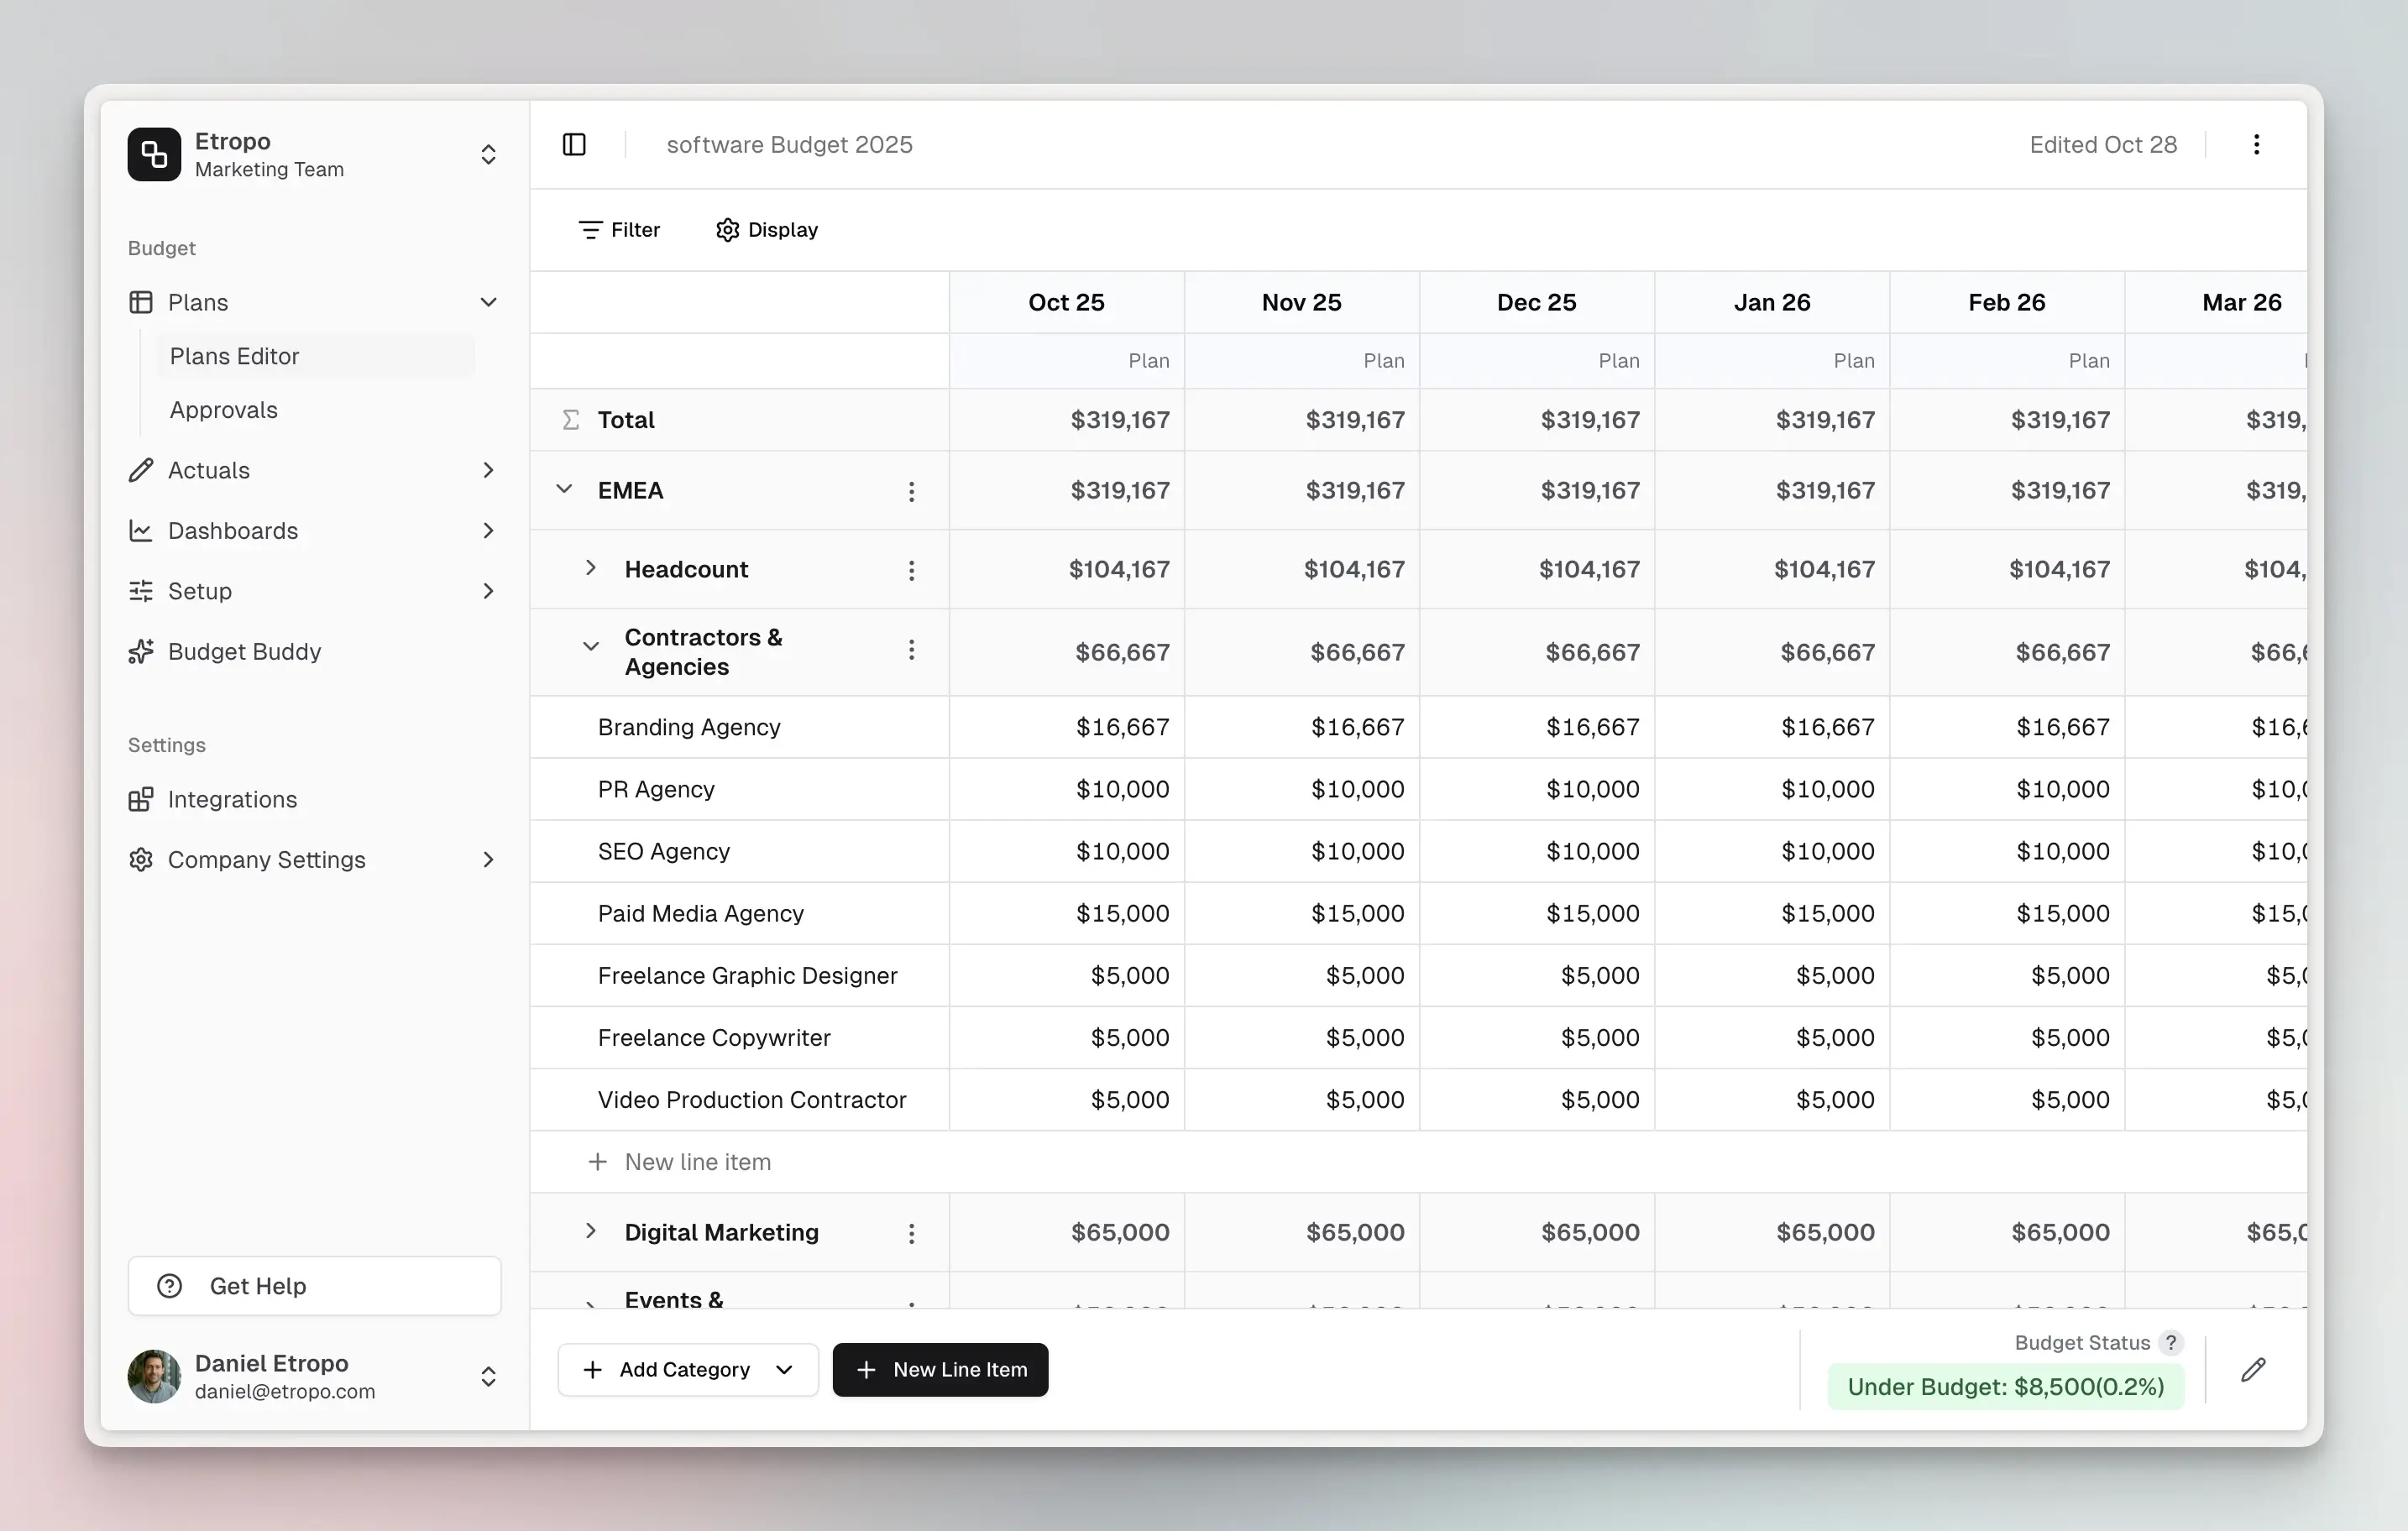
Categories
Categories organize your marketing budget into logical sections. Each category displays category totals and line items belonging to it.
Adding categories
- To create a new category, click “Add Category” in the footer
- To edit a category, click on the category name to modify:
- Name
- Description
- Access settings for your teammates
Deleting categories
Before deleting a category, note that this will:
- Remove all line items in the category
- Delete historical data
- Remove associated permissions
- Cannot be undone
Master Categories
For larger marketing budgets with many categories, you can enable master categories to create a two-level hierarchy. This feature is available on custom plans and can be toggled on/off in budget settings.
What are master categories? Master categories let you group related child categories under a parent. For example:
- EMEA (master) → Headcount, Paid Media, Content Marketing (children)
- Americas (master) → Headcount, Paid Media, Content Marketing (children)
- APAC (master) → Headcount, Paid Media, Content Marketing (children)
How it works:
- Master categories show aggregated totals from all their children
- Click the arrow to expand/collapse child categories
- Granting access to a master automatically includes all children
- Only admins can create or reorganize category structure
- Team members can view and work with accessible categories
When to enable:
- Your budget has 10+ categories that naturally group together
- You want simplified access control (grant access by region, channel, or team)
- You need to see totals by major marketing area at a glance
To enable, go to Settings tab → find your budget → toggle Master Categories ON. Learn more about the setting.
Category Access Rights
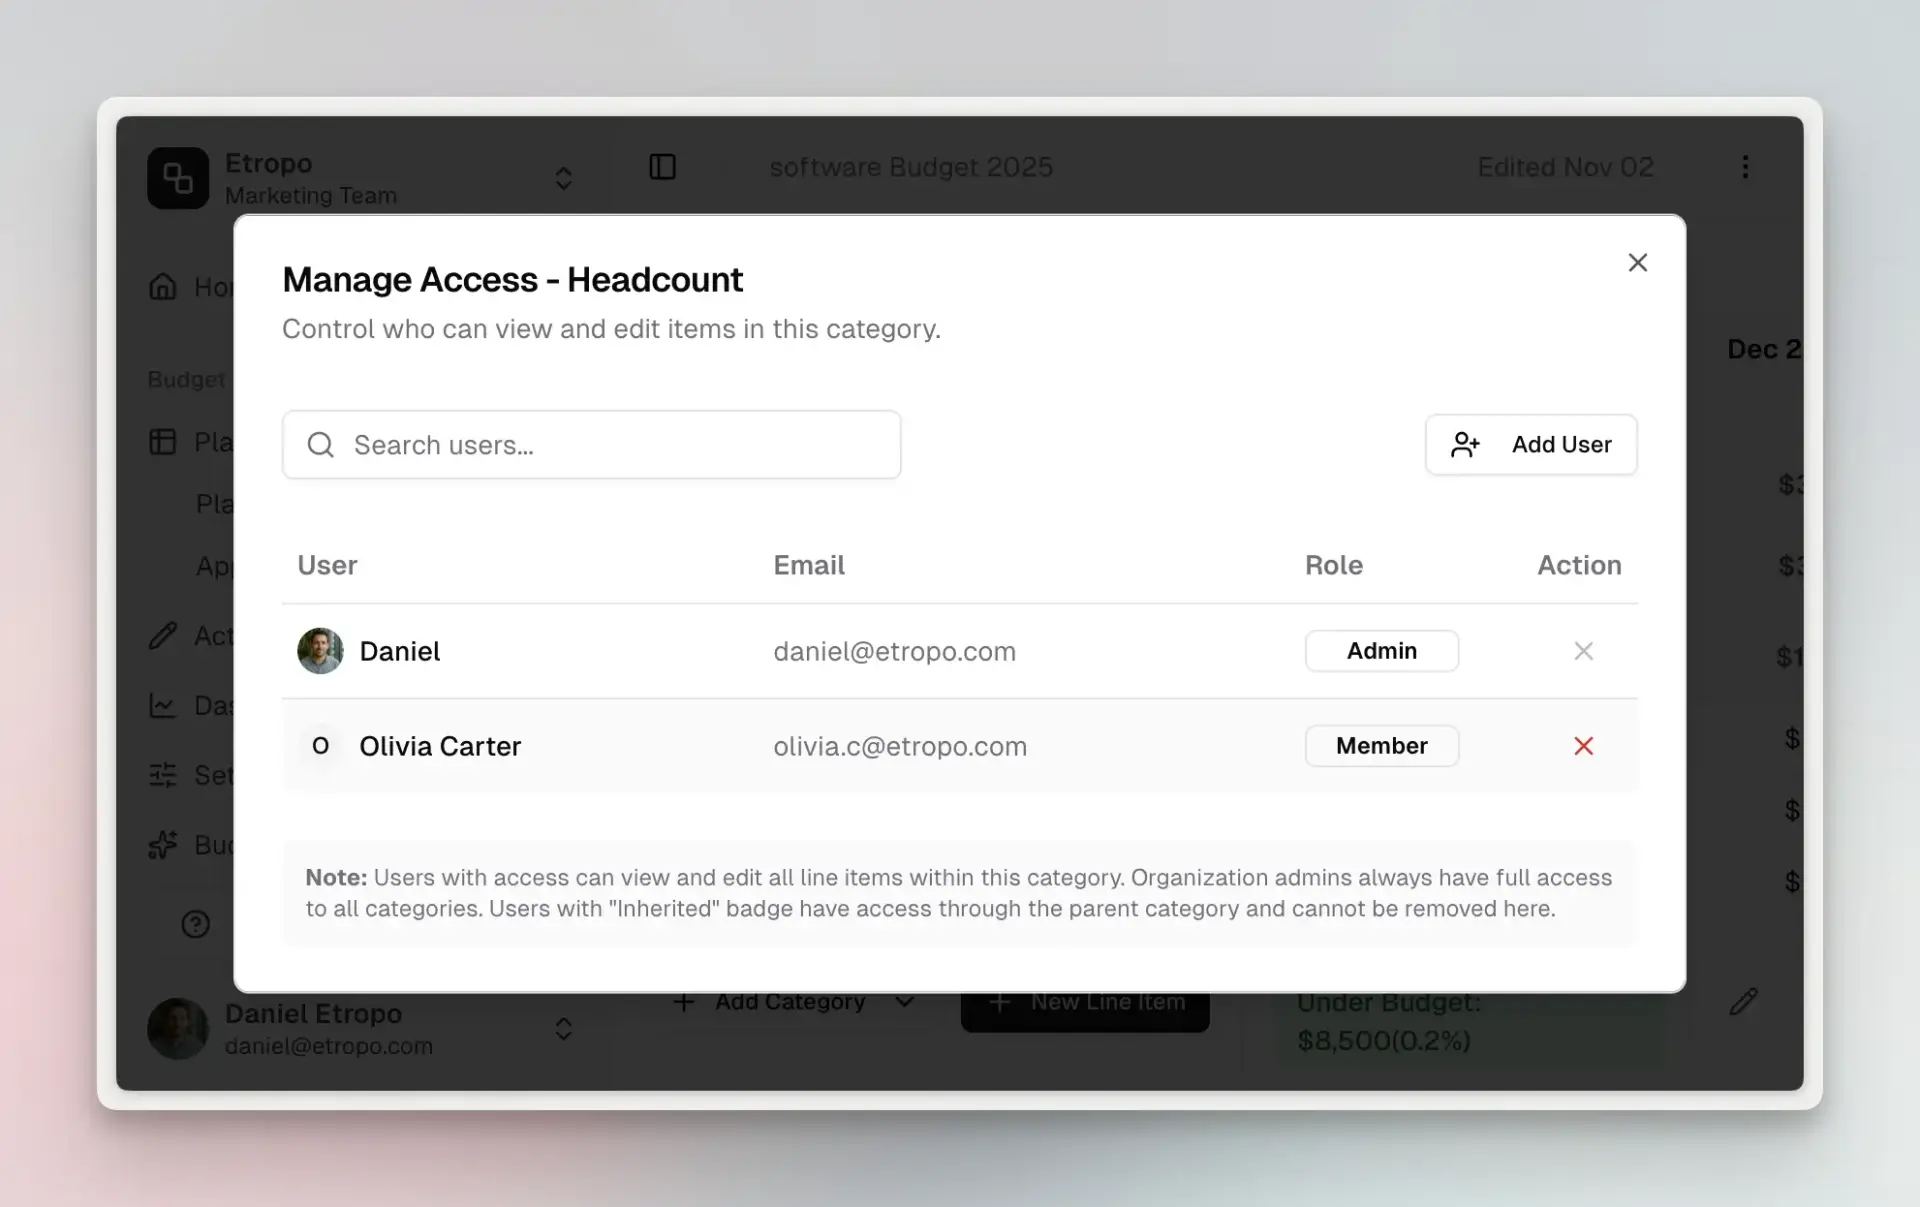
You can control who sees and edits each category:
- Admins see all categories and can manage access for other users
- Users only see categories they’ve been granted access to
- To manage access, click on a category name and select “Manage Access”
- For master categories: granting access to a parent automatically includes all child categories
Learn more about access control
Line Items
Creating line items
To add a new line item:
- Click the “Add Item” button in the footer
- Fill in the required fields:
- Name: Enter a descriptive name
- Category: Select from existing categories
- Currency: Choose from available currencies
Additional properties can be set up later by editing the line item.
Line Item Properties
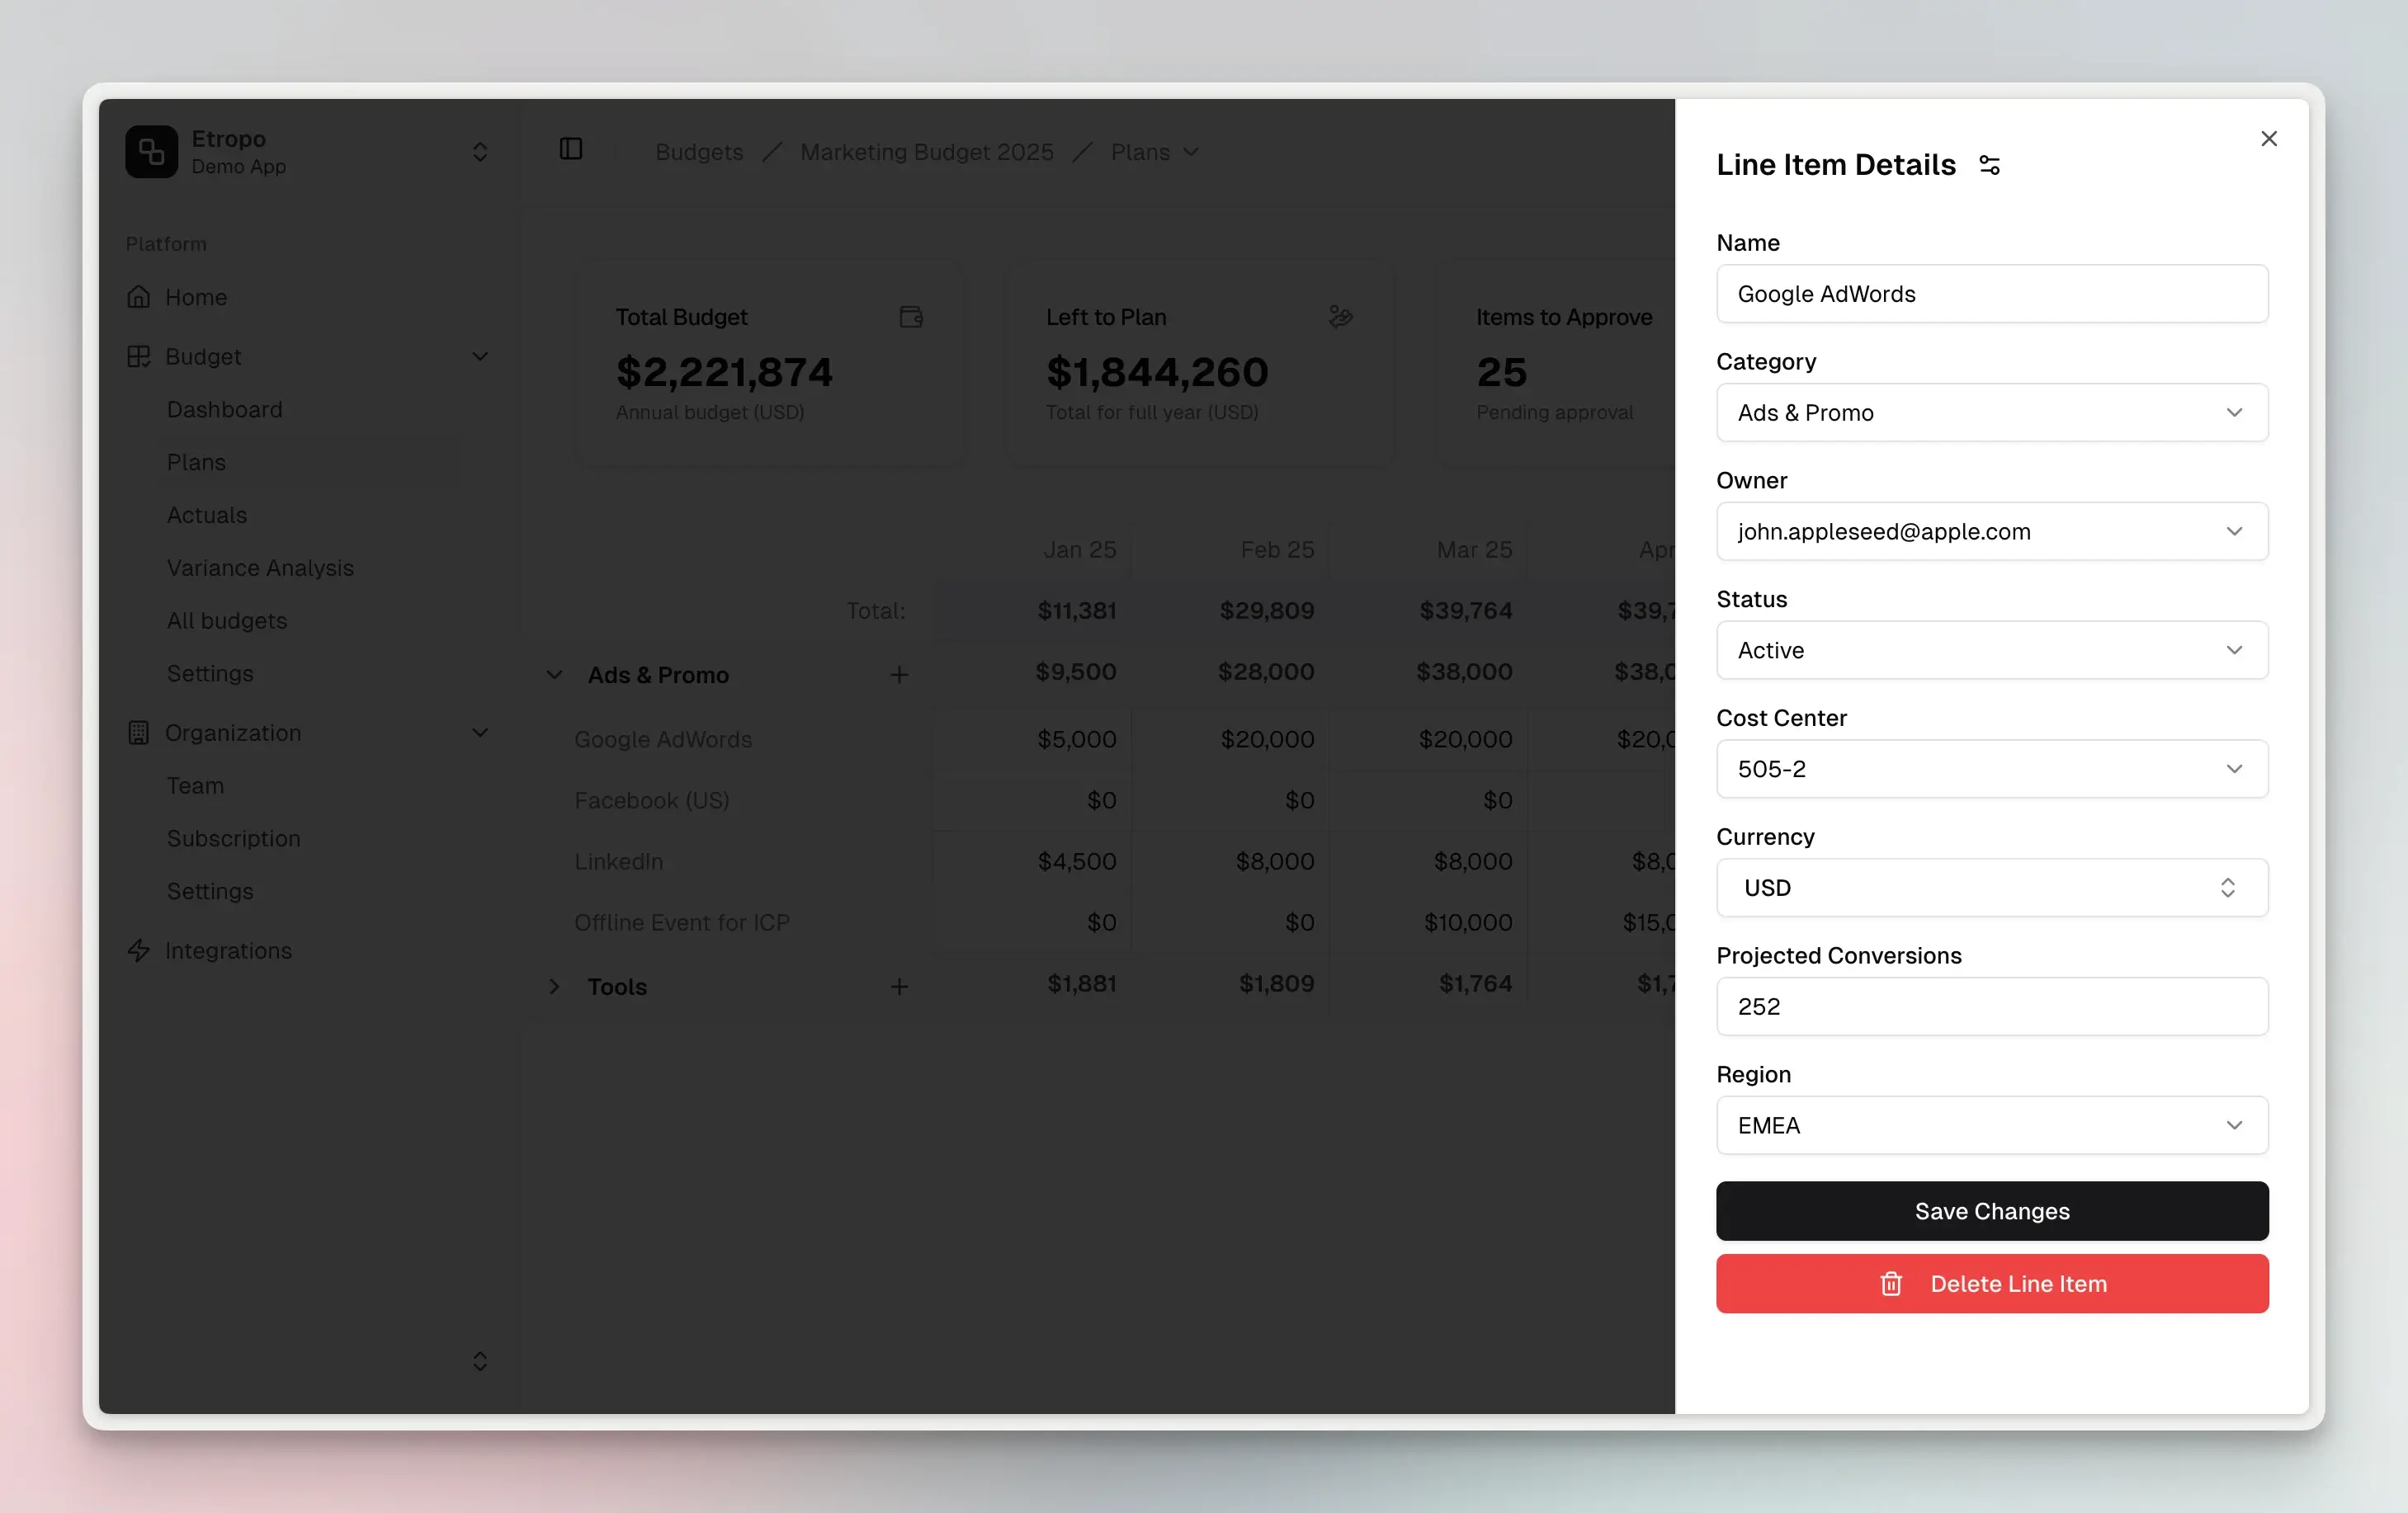
Each line item includes:
Basic Properties:
- Name: Identifier for the line item
- Status: Track progress (Draft/Active/Completed)
- Owner: Assign responsibility
- Category: Organizational grouping
- Currency: Set specific currency for this item
Custom Properties: Based on your needs, you can add custom properties of the following types:
- Single-choice dropdowns
- Text fields
- Numerical values
- True/false options
Learn how to add custom properties
Bulk Actions
When you select multiple line items in the budget grid, a bulk actions toolbar appears at the top, allowing you to perform operations on all selected items at once.
Available actions:
- Move to Category - Move all selected line items to a different category (cannot move to master categories or categories without access)
- Assign Property - Apply a property value to all selected items (text, number, boolean, or select properties)
- Assign Cost Center - Assign or remove cost center assignments across selected items
- Delete - Permanently delete selected line items (cannot be undone - removes all data including comments and integrations)
Note: Some actions require configuration (properties or cost centers) to be enabled.
Multi-Cell Operations
The Budget Grid supports Excel-like range selection functionality, allowing you to select multiple cells simultaneously for quick analysis and operations.
Multiple Cell Selection
You can select ranges of cells using several methods:
- Click and Drag: Click on a cell and drag to select a rectangular range
- Shift + Click: Select a cell, then hold Shift and click another cell to select the range between them
Navigation Shortcuts
Ctrl / CMD + Arrow Key Jump to the end of data in the direction of the arrow
Selection Shortcuts
Windows:
Ctrl + Shift + Arrow Key: Select from current cell to the end of data in the arrow directionShift + Arrow Key: Extend selection by one cell in the arrow direction
macOS:
Cmd + Shift + Arrow Key: Select from current cell to the end of data in the arrow directionShift + Arrow Key: Extend selection by one cell in the arrow direction
When you select a range of cells containing numerical values, Etropo automatically calculates and displays the sum of the selected cells. This feature provides instant insights into your budget data without requiring manual calculations.
When your selection includes line items with different currencies, Etropo automatically handles currency conversion:
- All values are converted to your organization’s default currency for the sum calculation
- Exchange rates are applied based on the rates configured in your currency settings
- The sum is displayed in your default currency
- Individual cell values remain in their original currencies
Currency Management
Etropo supports multiple currencies:
- Each line item can have its own currency
- All amounts convert to your default currency for totals
- Fixed exchange rates can be set in the currencies settings
More on currencies here.
Filtering
The Filters Panel available at the top of the Budget Grid, allows you to refine which line items are displayed in the budget. It provides a powerful way to focus on specific aspects of your budget data.
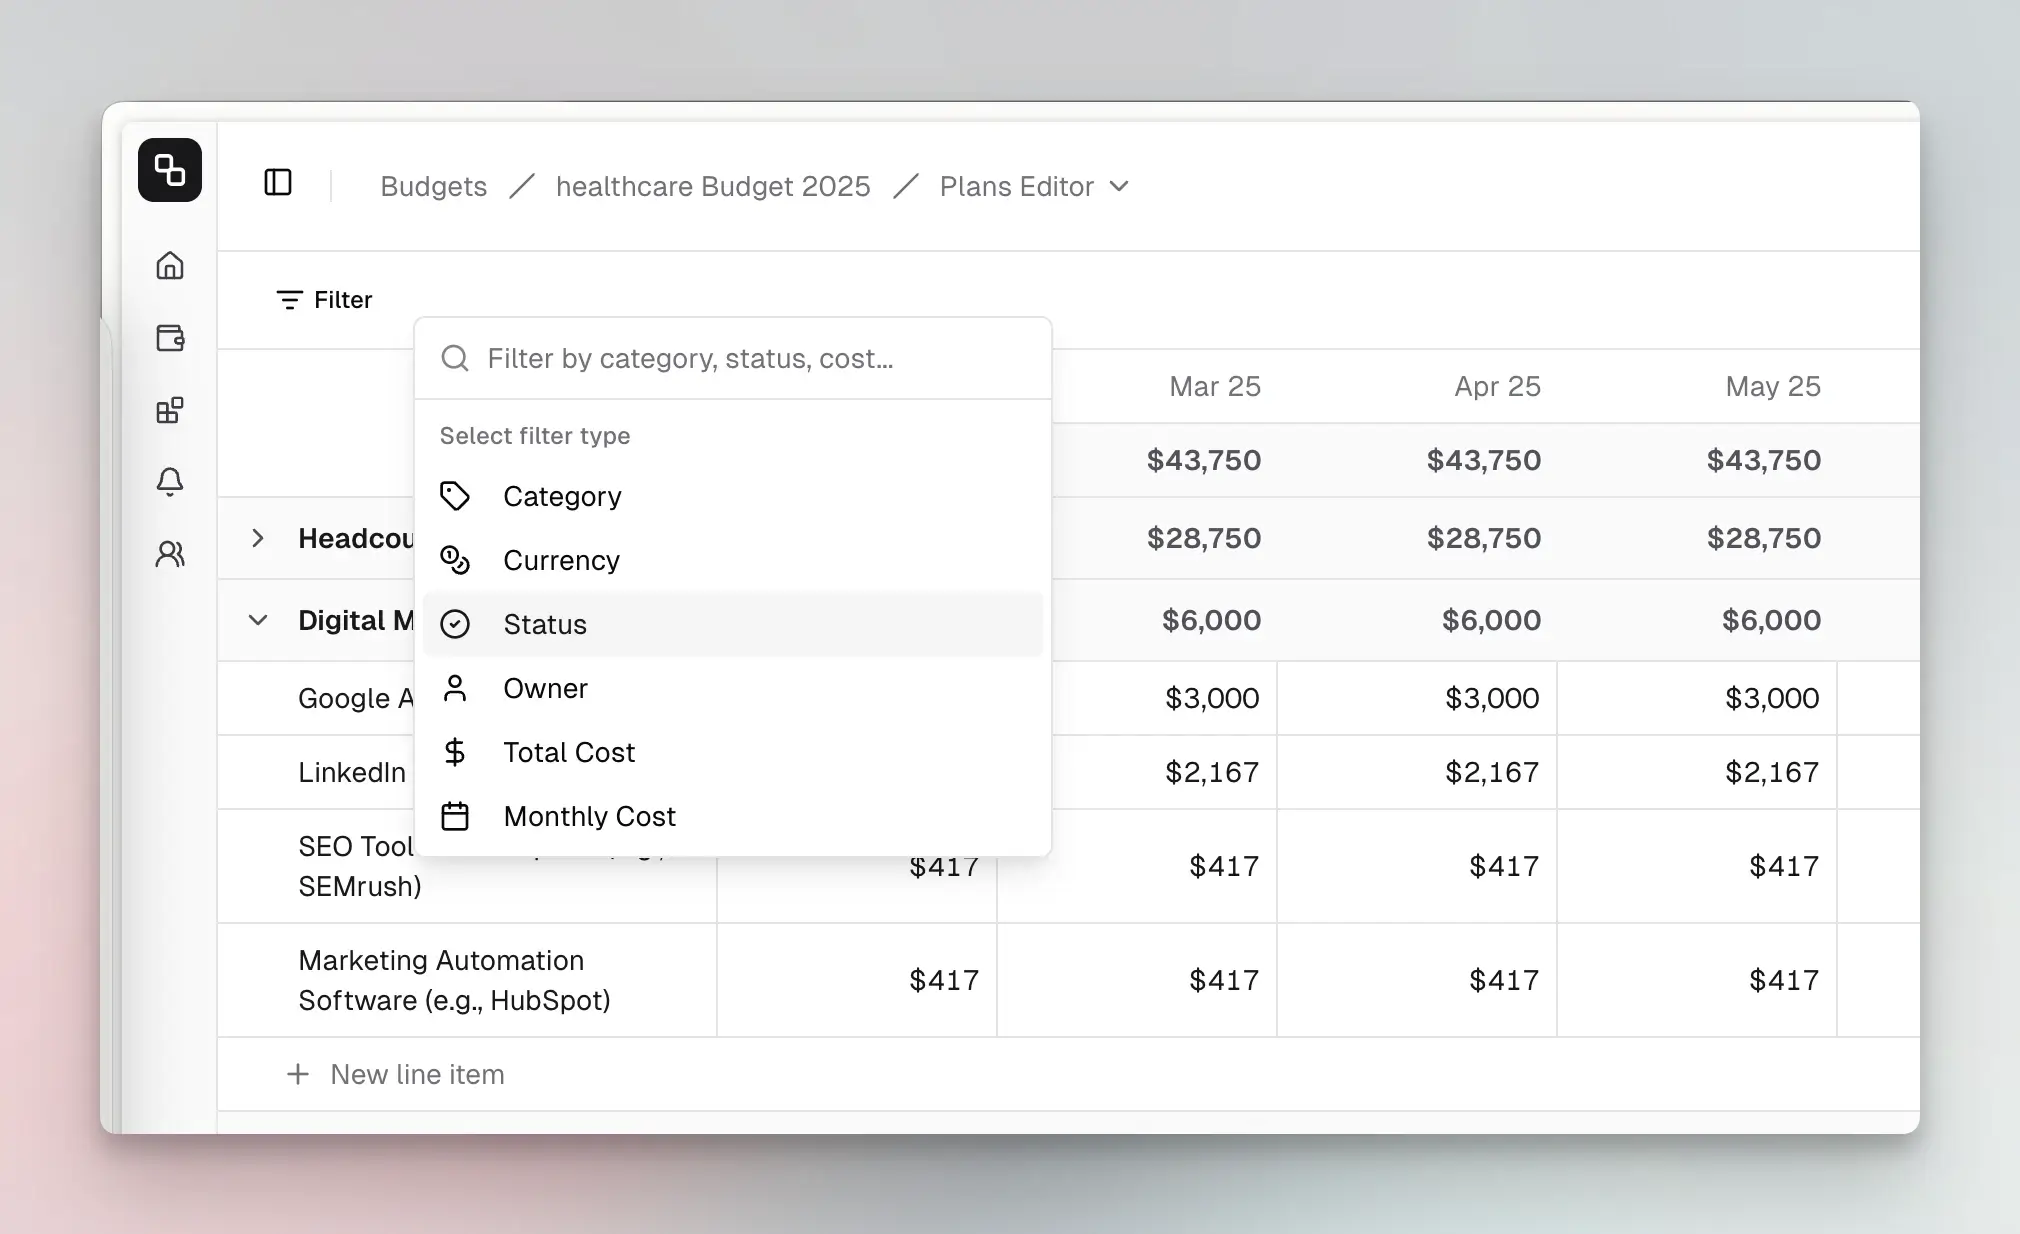
Available Filters
You can filter your budget by multiple criteria:
- Category: Filter by specific budget categories
- Currency: Show only items in particular currencies
- Status: Filter by item status (draft, pending approval, approved, rejected)
- Owner: See items assigned to specific team members or unassigned items
- Total Cost: Filter items based on their total cost using various comparison operators
- Monthly Cost: Find items with specific monthly spending patterns
Using Filters To add a filter:
- Click the “Filter” button in the filter bar
- Select the type of filter you want to apply
- Choose specific filter criteria or enter numeric values for cost filters
- For cost filters, you can select comparison operators like “Equal to,” “Greater than,” or “Less than”
Multiple filters can be applied simultaneously to narrow down your view. Each active filter appears as a tag in the filter bar, and you can remove individual filters by clicking the “X” icon on each tag or clear all filters at once with the “Clear all” button.
Display Settings
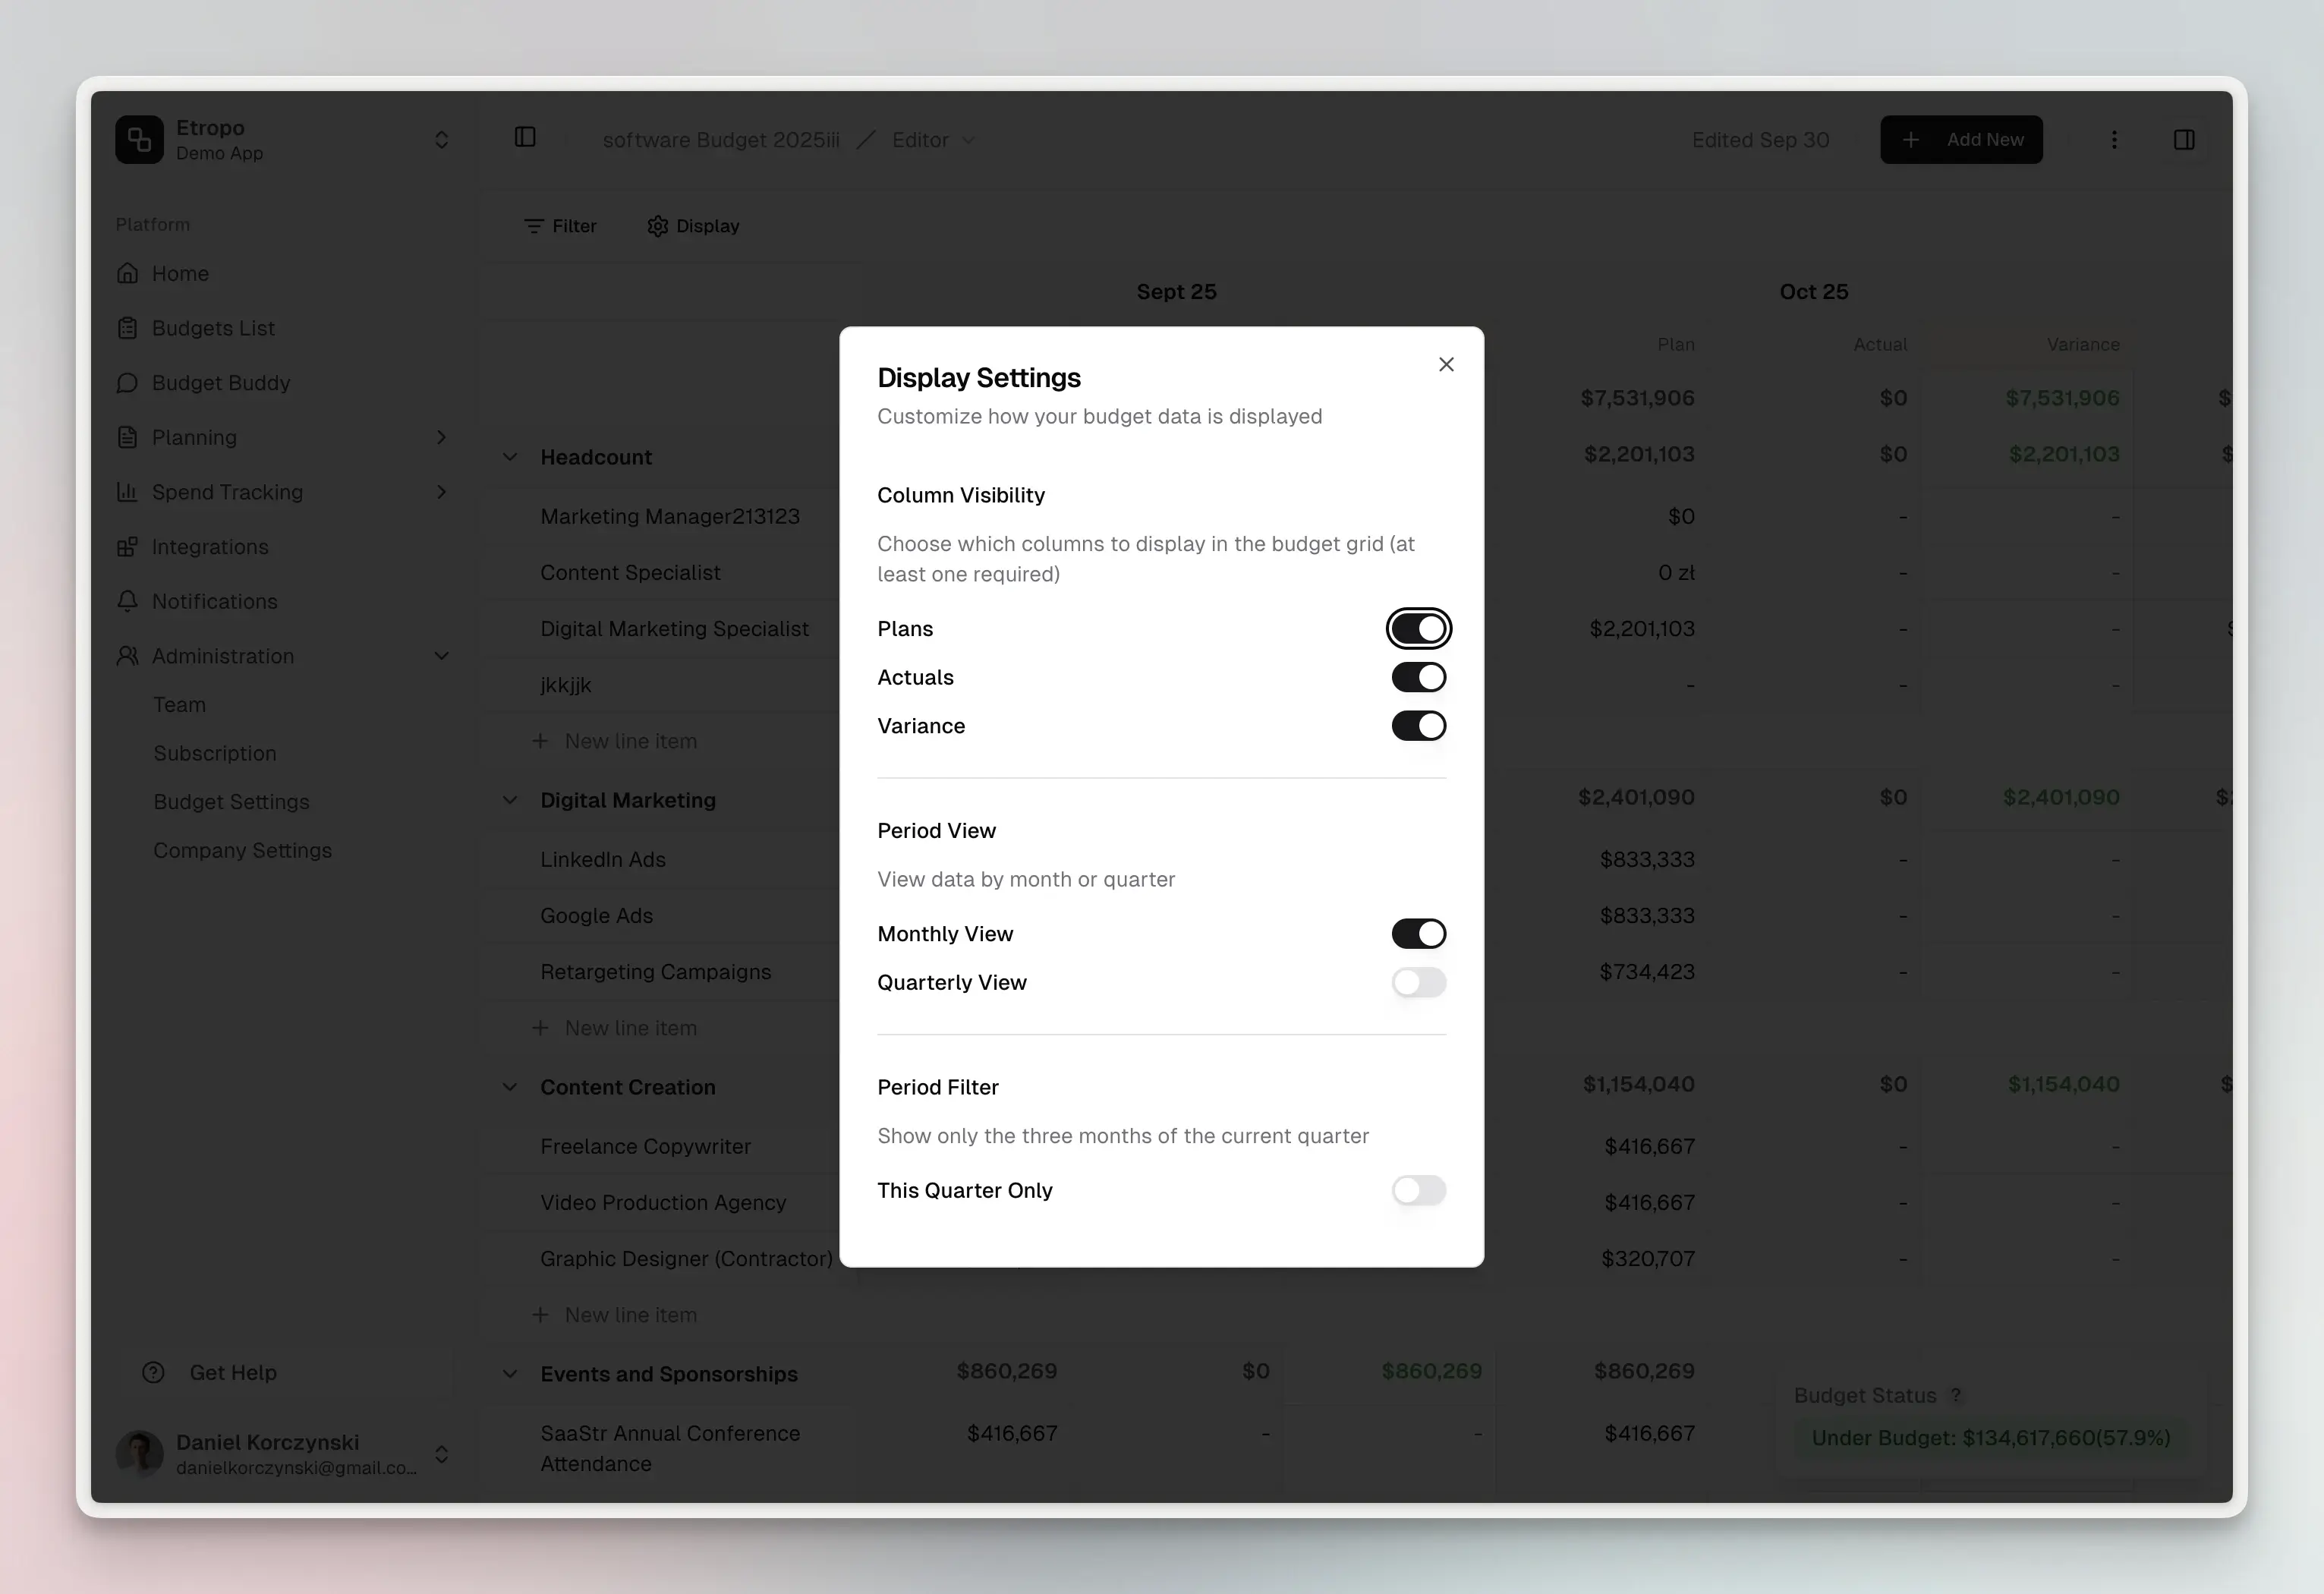
The Display Settings dialog provides control over how you view and interact with your budget data. Access it by clicking the “Display” button in the editor header.
Column Visibility
Control which data columns appear in your budget grid:
- Plans: Show planned budget amounts
- Actuals: Show actual spending amounts
- Variance: Show the difference between planned and actual (color-coded: green for under budget, red for over budget)
For draft budgets, the Plans column is shown by default. For active budgets, all three columns are visible by default.
Period Type
Switch between two viewing modes:
- Monthly View: Display budget data broken down by individual months
- Quarterly View: Aggregate data into quarters (Q1, Q2, Q3, Q4) for a higher-level overview
When viewing by quarter, amounts are automatically aggregated across the three months in each quarter.
- This Quarter Only: Filter the view to show only the current quarter’s data (available in both monthly and quarterly views)
This is useful when you want to focus on near-term budget management without the distraction of past or future periods.
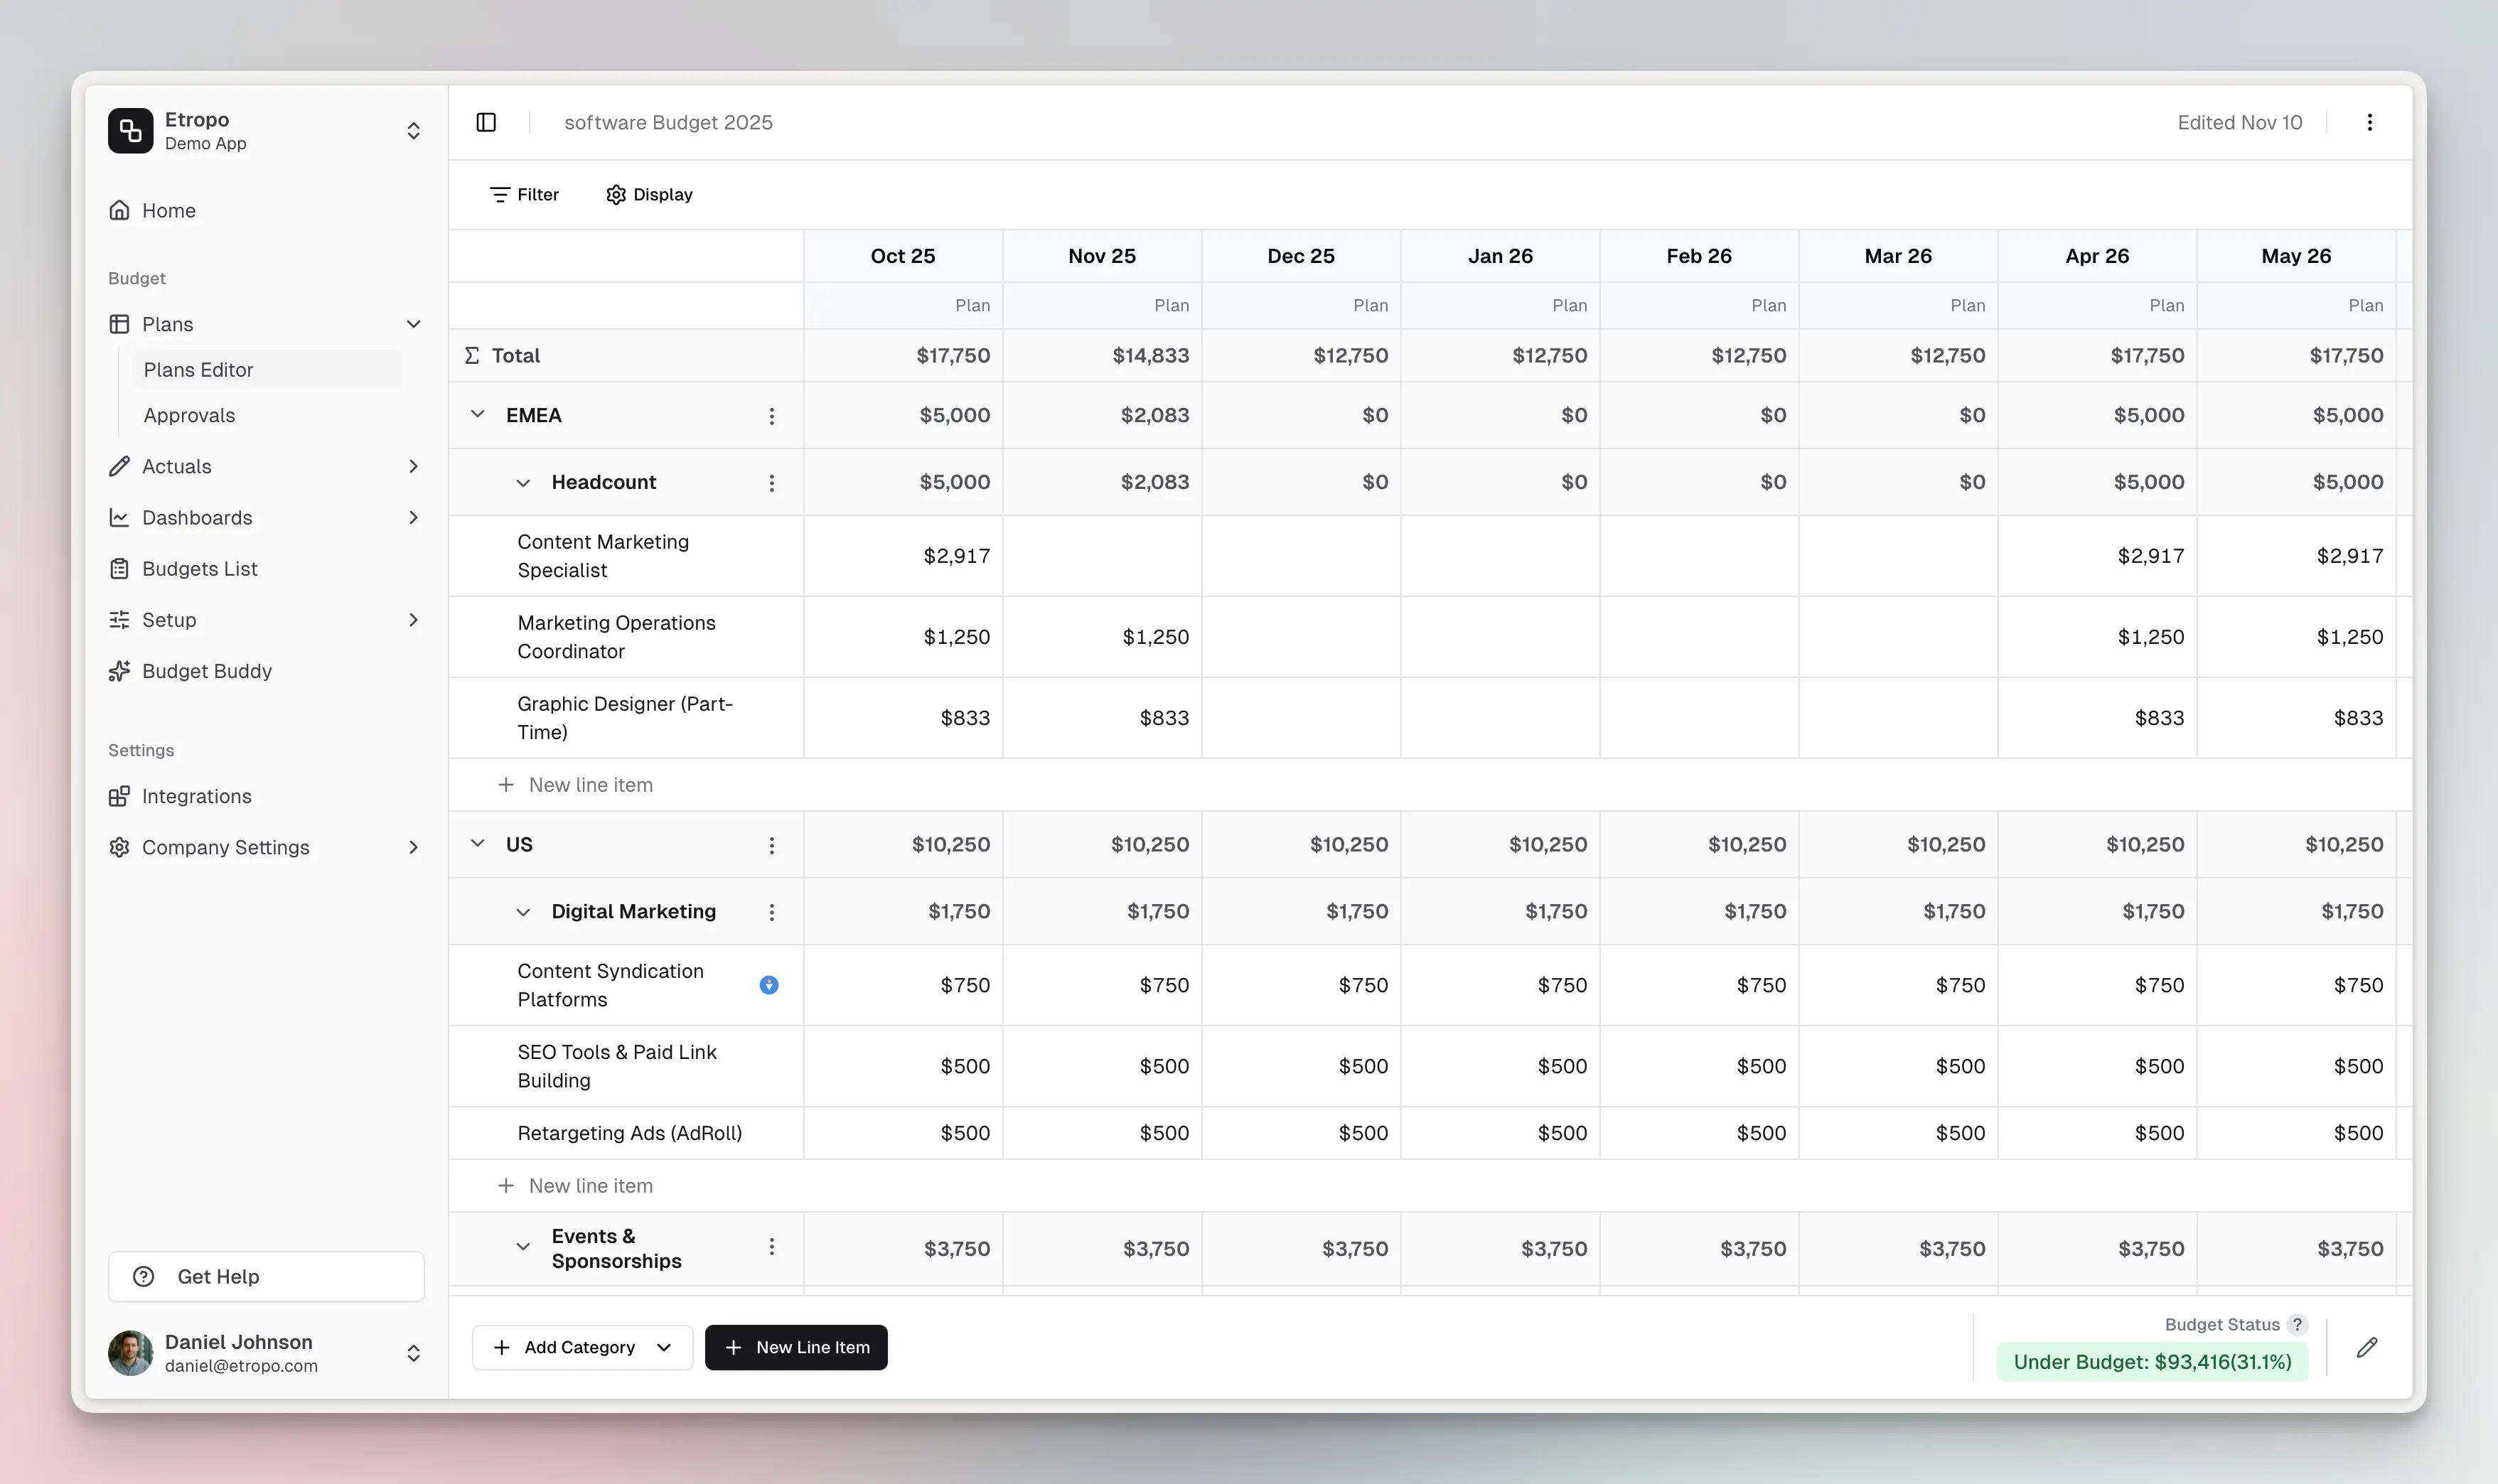
Managing Active Budgets
When working with active budgets, the Budget Status Badge in the bottom-right corner shows real-time performance against your target budget. The badge combines actual spending with planned values for months without actuals, giving you an accurate picture of your budget health.
Badge indicators:
- 🟢 Green: Under Budget
- 🔵 Blue: On Target
- 🔴 Red: Over Budget
The badge displays the amount and percentage you’re over or under your total target budget. For example, if your target is $10,000 and you’ve spent or planned $6,000, the badge shows “Under Budget: $4,000 (40%)”.
Best practices:
- Review your budget status weekly to catch issues early
- Adjust future month plans when actuals come in differently than expected
- Use comments to discuss significant budget adjustments with stakeholders