Understanding Marketing Spend
Overview
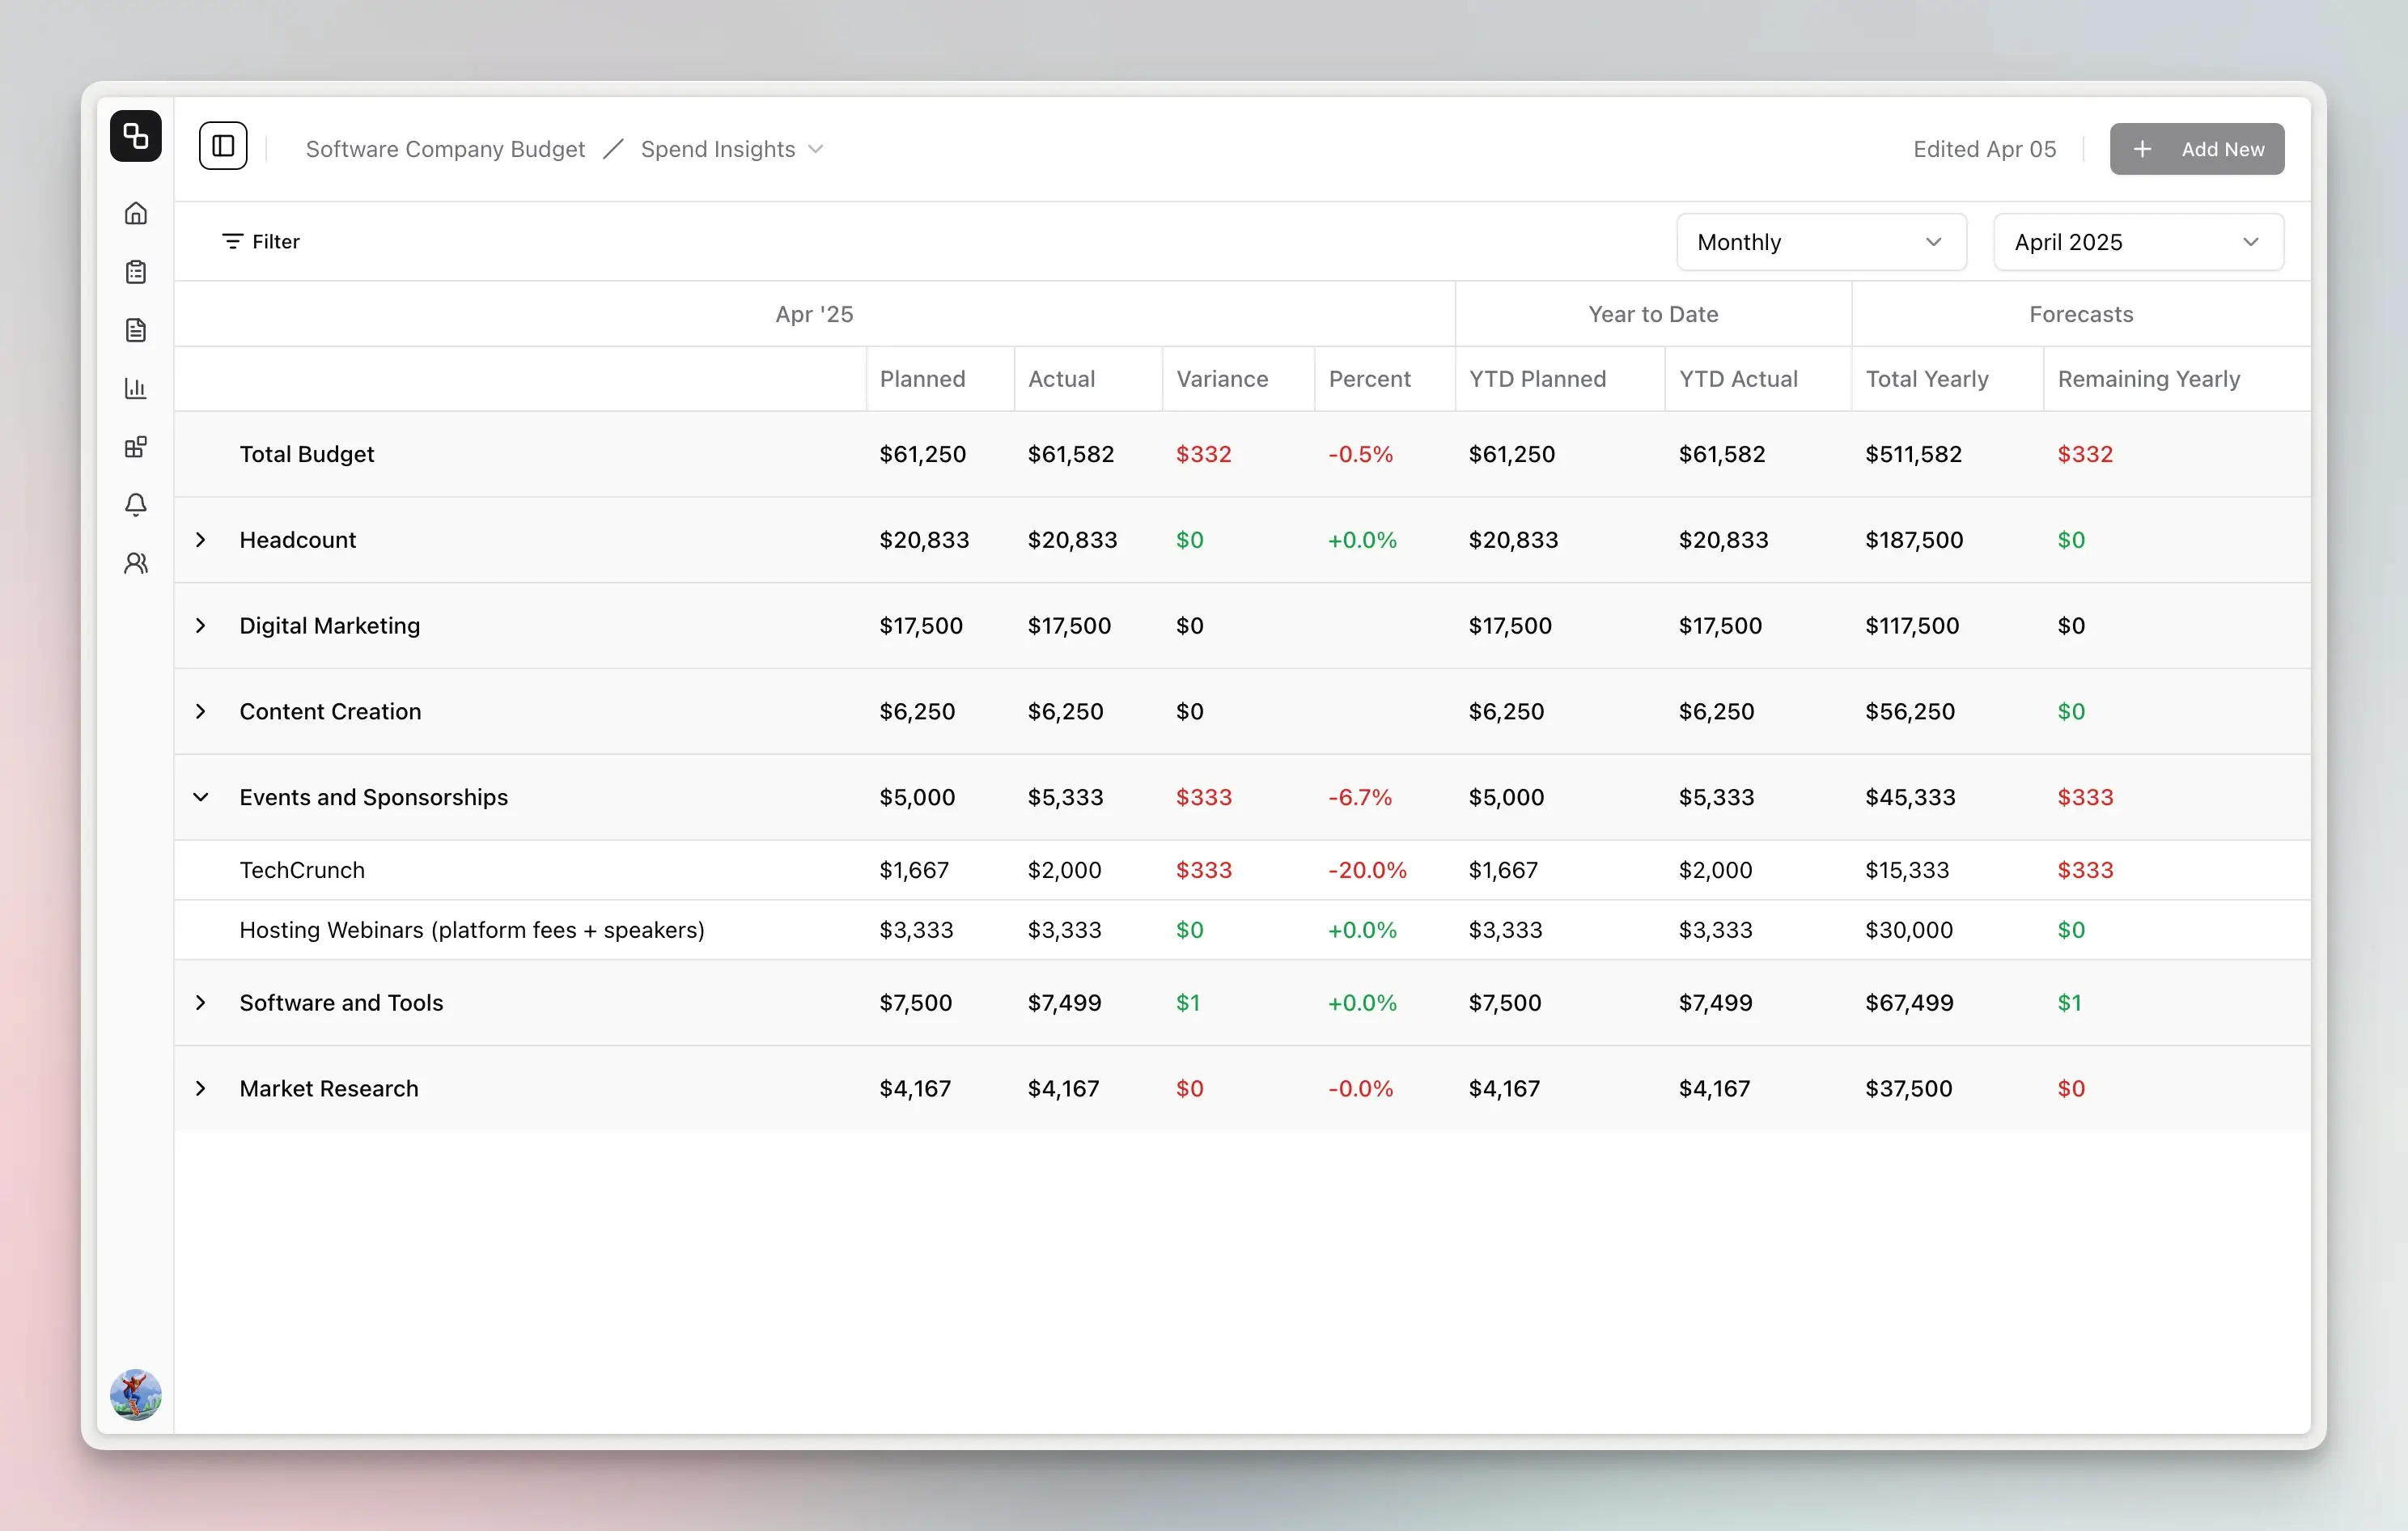
The Spend Insights view compares planned spending against actual expenditures. It helps you track variances, monitor year-to-date progress, and make informed decisions about your financial resources.
Key Features
Variance Analysis Table
The main component of the Spend Insights view is the variance analysis table, which displays:
- Period Data: Shows planned and actual spending for the selected period (month or quarter)
- Variance Metrics: Calculates the difference between planned and actual spending in both absolute amounts and percentages
- Year-to-Date (YTD) Analysis: Tracks cumulative planned and actual spending throughout the year
- Forecasting: Projects total yearly spend and shows remaining yearly budget
Hierarchical Data Organization
The table organizes financial data in a hierarchical structure:
- Budget Total: (Admin only) Shows aggregated totals across all categories
- Category Summaries: Displays totals for each budget category
- Line Items: Shows individual items within each category
Categories can be expanded or collapsed to focus on specific areas of interest.
For budgets with master categories enabled, variance analysis includes master category rows showing aggregated totals for all child categories, making it easier to analyze spending at a higher organizational level.
How to Use
Selecting Time Periods
Use the Period Selector in the top-right corner to:
- Choose between monthly or quarterly views
- Select the specific period you want to analyze
Filtering Data
The Filter allows you to narrow down displayed items by:
- Category
- Currency
- Status
- Owner
- Total Cost
- Monthly Cost
Interpreting the Data
Reading the Columns
- Planned: The budgeted amount for the selected period
- Actual: The actual spend recorded for the period
- Variance: The difference between planned and actual amounts
- Percent: The variance expressed as a percentage of the planned amount
- YTD Planned: Year-to-date planned spending
- YTD Actual: Year-to-date actual spending
- Total Yearly: Forecasted total spend for the year
- Remaining Yearly: The projected remaining budget for the year
Understanding Variance Values
- Positive Variance (Green): Indicates spending less than planned (under budget)
- Negative Variance (Red): Indicates spending more than planned (over budget)
- Missing Actuals: Shown as ”-” when no actual data is available
Variance Calculation
Variances are calculated using the following formulas:
-
Amount Variance:
Planned Amount - Actual Amount- A positive value means under budget (favorable)
- A negative value means over budget (unfavorable)
-
Percentage Variance:
((Planned Amount - Actual Amount) / Planned Amount) * 100- Displayed with a ”+” or ”-” sign to indicate direction
- Shows the percentage deviation from the plan
- Rounded to one decimal place (e.g., “+10.5%”)
- Shows “100%” for complete variances
-
Variance Status Classification:
- The system uses thresholds to classify variances as “normal,” “warning,” or “critical”
- Warning-level variances display a yellow alert triangle
- Critical-level variances display a red alert triangle
Forecast Calculation
Etropo calculates two types of forecasts:
-
Total Yearly Forecast:
- Represents the projected total spending for the entire fiscal year
- Calculated by combining actual spending to date with planned spending for future periods
- For line items with seasonality or changing monthly plans, the forecast reflects these patterns
-
Remaining Yearly Budget:
- Shows the difference between the total yearly forecast and the year-to-date actual spending
- Calculated as:
Total Yearly Forecast - YTD Actual - A positive value indicates remaining budget available
- A negative value indicates projected overspending by year-end
Tips for Effective Analysis
- Focus on Significant Variances: Pay special attention to items with large percentage variances or warning indicators
- Compare Categories: Analyze which categories have the largest variances to identify areas needing attention
- Track Trends: Monitor how variances change over time to spot developing issues
- Review YTD Performance: Use year-to-date figures to understand cumulative budget performance
- Check Forecasts: Review remaining yearly budgets to ensure sufficient funds for the rest of the year
Navigating Between Views
Use the Budget Header to switch between different views:
- Plans Editor
- Actuals Editor
- Approvals
- Plans Insights
- Actuals Insights
Currency Handling
The system automatically handles currency conversions for multi-currency budgets, displaying all figures in your default currency for easier comparison.