Budget Dashboards
Overview
Etropo provides two specialized dashboard views for budget analysis and insights:
- Plans Insights Dashboard - Budget allocation and distribution analytics
- Spend Insights Dashboard - Variance analysis comparing planned vs actual spending
Both dashboards are accessed through the budget view selector in the header when viewing a budget.
Plans Insights Dashboard
The Plans Insights Dashboard provides comprehensive visualization of budget allocation and distribution across time periods, categories, cost centers, and custom properties. The dashboard uses a tabbed interface with two main sections.
Allocation Tab
Monthly Budget Chart
View your total planned budget distribution over time in an interactive line chart.
Features:
- Period Grouping - Switch between monthly, quarterly, or half-yearly views
- Interactive Tooltips - Hover to see exact budget amounts
- Date Range Display - Shows the full range of your budget planning period
Budget Growth Table
Track how your budget changes over time with detailed period-over-period analysis.
Features:
- Flexible Time Period Views:
- Monthly breakdown
- Quarterly summary
- Half-yearly analysis
- For Each Period:
- Total planned budget amount
- Percentage change from previous period
- Color-coded changes: green for growth, red for decline
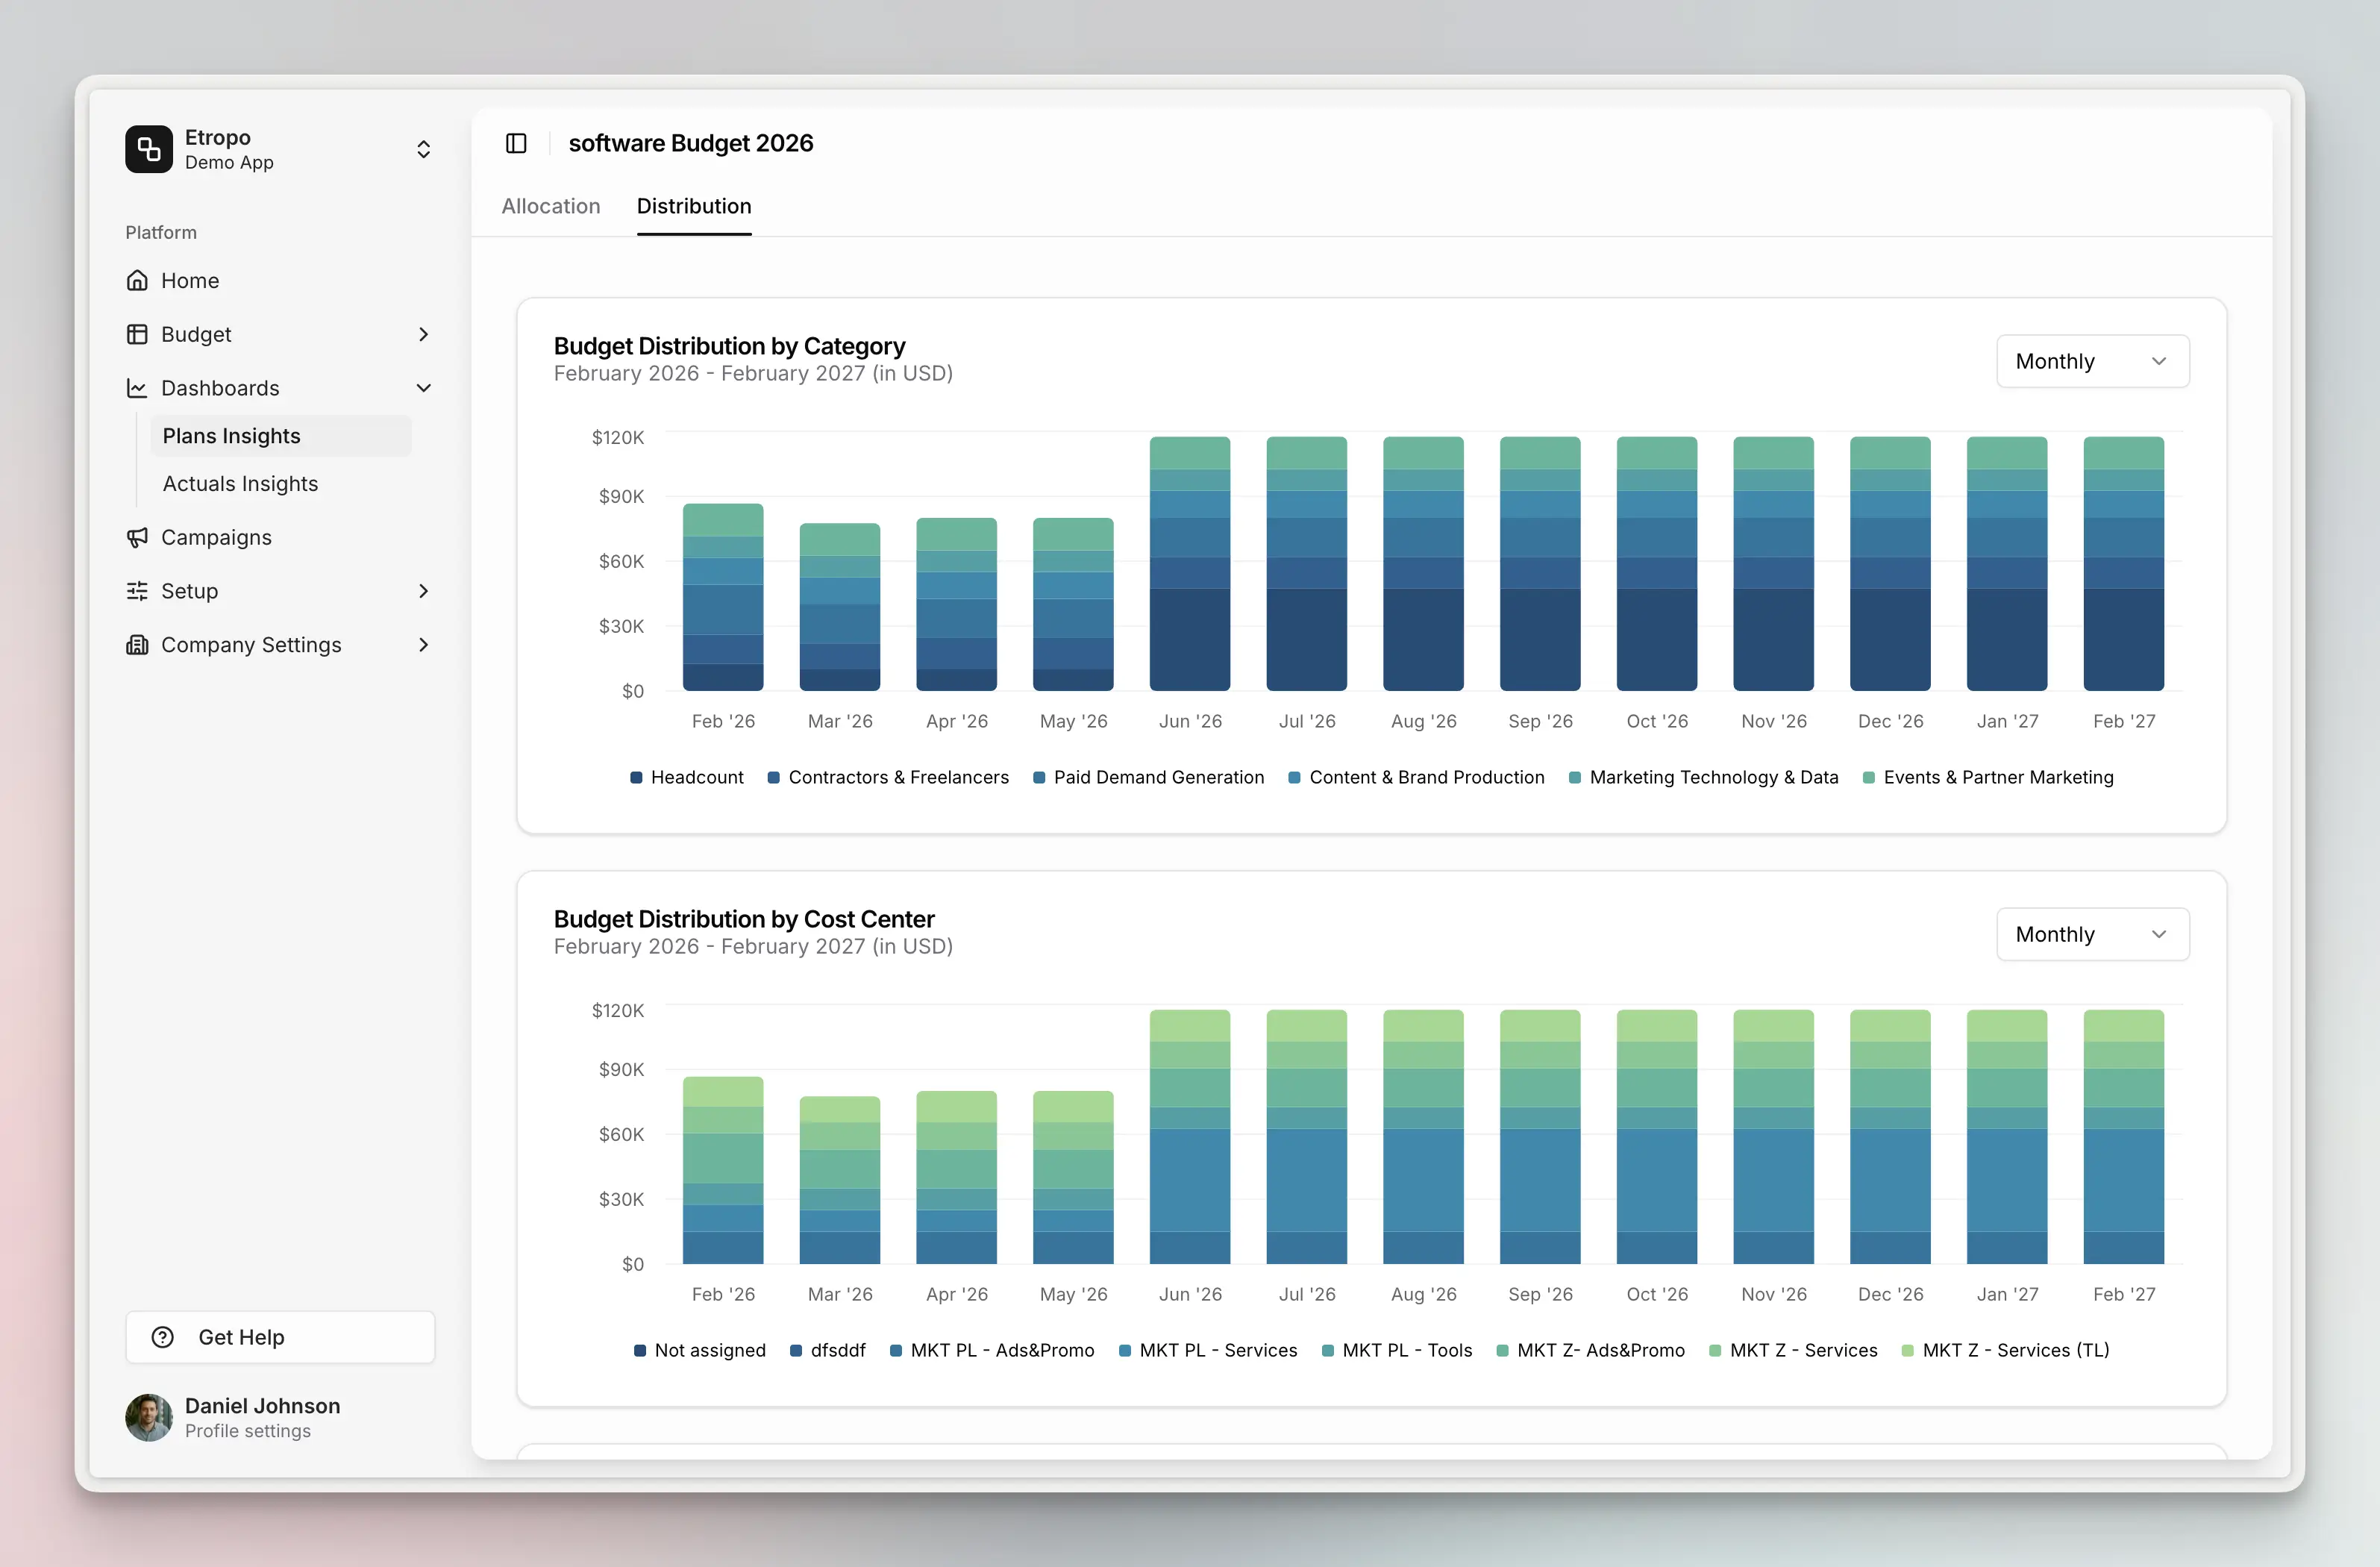
Distribution Tab
Category Breakdown Chart
See how your budget is distributed across different categories over time.
When master categories are enabled, the default view shows master categories and flat categories collapsed. You can select a master category to drill down into child categories. Child category amounts automatically roll up to their master in the default view.
Cost Center Distribution Chart
Visualizes budget distribution across cost centers when your organization uses cost center tracking.
Note: This chart only appears if your budget has cost centers configured. If no cost centers are defined, the chart will not be displayed.
Property Distribution Chart
Displays budget distribution across custom select-type properties (dropdown fields with predefined options).
Note: This chart only appears if your organization has select-type properties defined. Examples include Region, Department, or Priority fields.
Spend Insights Dashboard
The Spend Insights Dashboard enables variance analysis by comparing planned budgets against actual spending, with advanced filtering and period selection capabilities.
Filter Command Box
A command palette-style filter interface that allows you to quickly filter your budget data.
Available Filters:
- Category - Filter by specific categories, including master category expansion
- Currency - Filter by line item currency
- Status - Filter by approval status (draft, pending approval, approved, rejected)
- Owner - Filter by assignee or show unassigned items
- Cost - Filter by total cost or monthly cost with comparison operators (equals, greater than, less than, etc.)
Note: When filtering by a master category, all child categories within that master are automatically included in the results.
Period Selector
Choose the time period for your variance analysis.
Options:
- Period Type - Select Month or Quarter
- Specific Period - Choose from available periods within your budget
Variance Table
The variance table displays line items grouped by category with detailed planned vs actual comparisons.
Columns:
| Column | Description |
|---|---|
| Line Item | Name with expand/collapse controls for categories |
| Planned | Budgeted amount for the selected period |
| Actual | Actual spending for the selected period |
| Variance | Difference (Planned - Actual) |
Features:
- Hierarchical Categories - Expandable/collapsible category groups
- Master Category Support - Two-level hierarchy with master categories containing child categories
- Color-Coded Variance:
- Red text for over-budget items
- Green text for under-budget items
- Warning Icons - Critical variances are highlighted with warning indicators
- Currency Conversion - All amounts displayed in your organization’s default currency
Currency Handling
All dashboard widgets automatically handle currency conversion:
- All amounts are converted to your organization’s default currency before aggregation
- Large numbers are formatted compactly (e.g., “1.2M” instead of “$1,200,000”)
- Currency symbols are properly placed based on locale
Use Cases
Plans Insights Dashboard
- Present budget allocations to stakeholders
- Track budget growth trends over time
- Analyze category spending patterns
- Monitor investment distribution across cost centers
- Compare property-based budget allocation
Spend Insights Dashboard
- Monitor budget vs actual spending performance
- Identify over-budget categories or line items
- Analyze spending patterns by period
- Filter and focus on specific budget segments
- Track variance trends for better forecasting